The Ultimate Guide to Distinctive Asset Grid
Most CMOs guess which brand assets actually drive recognition. The distinctive asset grid replaces that guesswork with a data-driven map of fame and uniqueness — showing you exactly where your brand equity lives.
The Brand Measurement Tool Most CMOs Underuse
The distinctive asset grid is a strategic framework — originally developed by Jenni Romaniuk at the Ehrenberg-Bass Institute — that plots brand assets on two axes, Fame (how many category buyers recognize the asset) and Uniqueness (how many of those buyers associate it exclusively with your brand), to determine which assets deserve investment, which need protection, and which are quietly draining budget.
Quick answer: What is the Distinctive Asset Grid?
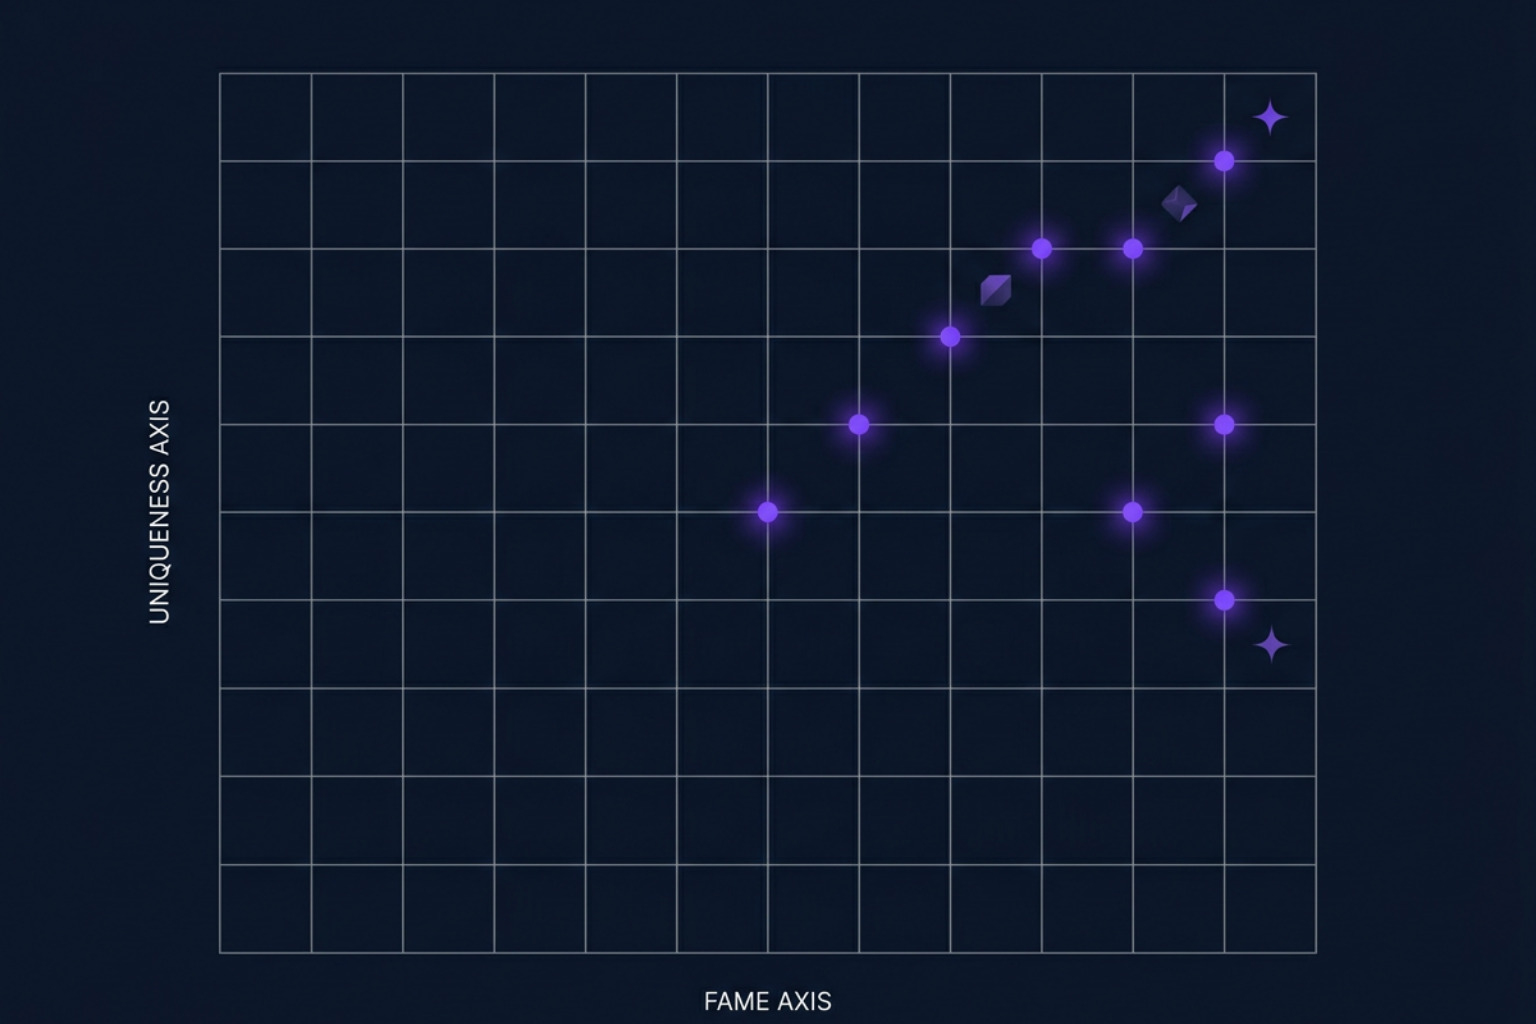
- Fame axis: The percentage of category buyers who correctly recognize a brand asset
- Uniqueness axis: The percentage of people who associate that asset with only your brand
- 50% threshold: Assets clearing both 50% Fame and 50% Uniqueness are statistically likely to trigger brand recall at the moment of purchase
- Four quadrants: Crown Jewels (high Fame, high Uniqueness), Future Stars (low Fame, high Uniqueness), Danger Zone (high Fame, low Uniqueness), Resource Drains (low Fame, low Uniqueness)
- Strategic output: A data-driven map telling you exactly where to spend, hold, or stop
Most brand decisions still get made by gut. A CMO defends a color palette because it "feels ownable." A creative director retires a character because it feels dated. A rebrand launches because the CEO got bored. The result is predictable: assets that took a decade to embed in memory get discarded, and the brand starts over from zero — invisibly, expensively. Tropicana learned this in 2009 when a packaging overhaul erased the iconic "orange with a straw" design and cost an estimated $26.3 million in sales before the original was restored. The asset had been doing real commercial work. Nobody measured it until it was gone.
The core problem is structural. On average, half of the people who see an advertisement fail to correctly identify the brand behind it. That number should end every internal debate about whether brand distinctiveness is a "soft" metric. It is not. It is a direct measure of whether your media spend is building your brand or inadvertently building a competitor's.
Half of your ad impressions may be working for someone else. The Distinctive Asset Grid tells you which half.
I'm Florian Radke — brand strategist, fractional CMO, and founder of The Brand Algorithm — and over 25 years of building brands across DTC, SaaS, and global consumer categories, the distinctive asset grid has become one of the most reliable tools I return to when a brand needs to stop debating identity and start measuring it. What follows is the framework in full, applied to the decisions senior marketers are actually facing right now.
Deconstructing the Distinctive Asset Grid: Fame vs. Uniqueness
To manage a brand portfolio, we must first stop treating "familiarity" as a proxy for brand strength. Familiarity is cheap. It means people have seen your asset. It does not mean they know it is yours.
The Distinctive Asset Grid forces us to separate these two concepts by plotting every brand element — whether it is a logo, a color, a character, a tagline, or a packaging shape — along two distinct, consumer-validated metrics:
- Fame (Asset Recognition): The percentage of category buyers who recognize the asset when shown it in isolation (de-branded). This measures the sheer strength and reach of the memory structure.
- Uniqueness (Brand Attribution): The percentage of those recognizing the asset who attribute it to your brand, and only your brand. This measures exclusivity.

When we evaluate assets, we are looking for how hard they work in the wild. If you want to know how your assets stack up against competitor elements, you must measure them against actual category buyers, not just your loyal customers. This is how you build a true diagnostic map of your brand equity. For a deeper dive into how this fits into overall brand valuation, read our guide on How to Measure Brand Equity.
The 50% Thresholds in the Distinctive Asset Grid
The grid is divided by a vertical line at 50% Uniqueness and a horizontal line at 50% Fame. These are not arbitrary markers chosen for visual symmetry. They represent a critical psychological tipping point.
- The 50% Fame Threshold: If fewer than 50% of category buyers recognize your asset, it lacks the mental market share to act as a reliable trigger. It is still a niche signal.
- The 50% Uniqueness Threshold: If fewer than 50% of those who recognize the asset attribute it to your brand, you have a high risk of competitor attribution. When people see your asset, they are just as likely to think of your rival. You are subsidizing their marketing.
When an asset clears both 50% thresholds, it enters the zone where it can actively substitute for your brand name in creative executions. It becomes a cognitive shortcut. This is the foundation of modern, sophisticated brand building, which we outline in our Brand Strategy Brief Guide 2026.
The Four Quadrants of Brand Equity Allocation
By plotting Fame against Uniqueness, we categorize every brand element into one of four operational quadrants. Each quadrant demands a completely different strategic response.
| Quadrant | Fame | Uniqueness | Strategic Action | Business Impact |
|---|---|---|---|---|
| Crown Jewels (Use or Lose) | High (>50%) | High (>50%) | Feature prominently, protect, enforce consistency | Drives instant mental availability; can replace brand name |
| Future Stars (Invest) | Low (<50%) | High (>50%) | Scale media exposure, increase frequency | High potential to become a Crown Jewel; highly ownable |
| Danger Zone (Avoid/Pivot) | High (>50%) | Low (<50%) | Phase out, redesign, or link tighter to brand | High risk of driving sales to competitors |
| Resource Drains (Ignore) | Low (<50%) | Low (<50%) | Divest immediately, stop spending creative resources | Useless noise that dilutes core brand signals |
Crown Jewels (Use or Lose) and Future Stars (Invest)
The top-right quadrant contains your Crown Jewels (often called the Hero quadrant in traditional Ehrenberg-Bass terminology). These are assets with high recognition and high exclusive attribution.
Think of Red Bull's blue-and-silver can, the Nike Swoosh, or McDonald's Golden Arches. In B2B, think of Salesforce's Astro character. These assets are so deeply embedded in the consumer's brain that they trigger brand recall instantly. The strategic mandate here is simple: do not touch them. Use them consistently across every touchpoint. They are your primary drivers of mental availability.
For assets in the bottom-right quadrant — Future Stars (or the Invest quadrant) — the asset is highly unique to your brand, but not yet famous. Johnnie Walker's "Keep Walking" tagline historically sat here before massive, sustained media investment pushed it upward.
Because these assets are already uniquely yours, they represent your highest-return investments. They do not suffer from competitor confusion; they just need scale. If you are building a B2B brand, finding and funding your Future Stars is the fastest way to escape the sea of generic corporate stock imagery. We detail this exact playbook in our B2B Branding Strategy Complete Guide.
Danger Zone (Avoid) and Resource Drains (Ignore)
The top-left quadrant is the Danger Zone (the Watchout quadrant). This is where well-meaning marketers make their most expensive mistakes. These assets have high fame but low uniqueness. They are often category-generic elements.
For example, a specific shade of blue for a tech company, or a generic image of coffee beans for a cafe brand. Nespresso's standard cup shape often falls here because while everyone recognizes it as a coffee element, they do not attribute it uniquely to Nespresso.
If you invest in a Danger Zone asset, you are essentially funding category awareness that benefits your competitors. If you are a mid-market player using a generic asset, you are likely just sending mental traffic to the market leader.
Finally, the bottom-left quadrant contains the Resource Drains (Test or Ignore). These are elements that are neither famous nor unique. They are often the result of internal vanity projects — a secondary graphic device, a minor sub-brand logo, or a complex corporate pattern. Stop spending money on them. They are diluting your creative focus and your budget.
The Cognitive Moat Framework: Strategic Asset Management in the Age of AI
In an era where generative AI can produce infinite volumes of content for zero marginal cost, the assets that live in consumers' minds are your only true defense. If your brand relies on generic copy, standard layouts, and common stock styles, AI will commoditize you overnight. We call our methodology for defending against this the Cognitive Moat Framework.

This framework treats brand assets not as design elements, but as scarce, high-yield capital assets. It is designed to help senior marketers transition from subjective design debates to rigorous, algorithmic asset management. To understand how algorithmic discovery changes the rules of engagement, read our analysis on Brand Strategy in the Age of AI and our comprehensive AI Brand Strategy Complete Guide.
Here is how to execute the Cognitive Moat Framework in four steps:
Step 1: De-branded Asset Auditing
You cannot manage what you do not measure objectively. To audit your assets, you must strip away the brand name and present elements in isolation to a qualified sample of category buyers.
- The Stimuli: Show the asset alone. If it is a color, show the color block. If it is a tagline, show the text. If it is a packaging shape, show a 3D silhouette.
- The Question: Ask open-ended questions: "What brand, if any, comes to mind when you see this?" Do not provide a multiple-choice list. Multiple-choice tests measure recognition, not active recall.
- The Sample: For a national B2C or CPG brand, a sample of 300-500 category buyers provides statistically sound results. For smaller B2B or regional markets, a qualified sample of 150-200 people is sufficient.
The same logic drives the automated, system-wide strength evaluations used in other complex industries: you map nodes of strength and identify where the system is most vulnerable to failure. Your brand portfolio behaves no differently.
Step 2: Portfolio Allocation and Risk Analysis
Once you have your Fame and Uniqueness scores, plot them on your grid. Treat this grid like a financial portfolio. You want to understand your total risk exposure.
If 80% of your marketing budget is supporting assets in the Danger Zone, your portfolio is highly volatile. You are carrying massive competitor risk. Just as a disciplined investor reconstructs portfolio truth by analyzing real exposure and risk-adjusted performance across every holding, you must look at your brand elements collectively. A single strong asset cannot carry a portfolio of weak, confusing elements.
Step 3: Hybrid Project Modeling and Deployment
Before launching a new campaign, model how your assets will work together. Distinctive assets do not operate in a vacuum. A tagline works better when paired with a consistent visual style; a character works better when paired with a signature sonic cue.
Think of it like utility-scale energy modeling, where developers simulate how different commercial arrangements, storage variables, and local rules will perform in the real world before laying a single cable. You want that same scenario-modeling discipline before you commit budget to a brand asset.
As a marketer, you must run similar simulations. How does your asset mix perform across different media channels? If you run a digital-only campaign without your signature visual assets, does your brand attribution collapse? Model these scenarios before you commit your media budget.
Step 4: Tokenized Consistency and Governance
The biggest enemy of distinctive assets is internal boredom. Creative teams get tired of using the same colors, the same fonts, and the same layouts. They want to innovate. But to the consumer, your brand is a tiny fraction of their daily mental load. Every time you change an asset, you erase a memory structure.
We must treat our Crown Jewels as scarce, immutable assets — protected with the same discipline used to manage any capped, high-value resource, where strict limits on supply are exactly what preserve long-term value.
Your brand assets should have a similar "hard cap" on modification. Once an asset is certified as a Crown Jewel, lock it down. It is non-negotiable. It must accompany every creative execution, acting as a permanent signature that guarantees your media spend actually returns dividends to your balance sheet.
Common Pitfalls in Brand Asset Measurement
When brands attempt to build and interpret their own distinctive asset grid, we consistently see the same four errors:
- Measuring the Wrong Audience: Testing assets on your brand advocates or internal employees is useless. They already know your brand too well. You must test on light category buyers and competitor buyers. This is where the real battle for mental availability is won or lost.
- The Color Ownership Fallacy: Marketers obsess over "owning" a color. But unless you are Cadbury (with their specific royal purple) or Tiffany & Co. (with their robin's egg blue), you cannot own a single color. Humans are incredibly poor at recalling specific color shades in isolation. Coca-Cola, HSBC, Netflix, and The Economist are all red brands. They do not own red; they own red in combination with highly specific typographic and graphic devices.
- Overestimating Taglines: Taglines are inherently harder to build into distinctive assets than visual elements. Auditory and linguistic memory structures require far more repetition to stick. While Johnnie Walker's walking man image quickly achieved 53% Fame and 77% Uniqueness, its "Keep Walking" tagline lagged significantly in Fame despite decades of use.
- Insufficient Sample Sizes: Sinking millions into a rebrand based on a focus group of 15 people is professional negligence. You need quantitative validation. Stick to the gold standard: 300-500 category buyers for national consumer brands to ensure your data is statistically sound.
Frequently Asked Questions About Brand Distinctiveness
How often should a brand update its distinctive asset grid?
We recommend a comprehensive measurement every 18 to 24 months. Memory structures do not change overnight; they take years to build and years to decay. However, you should run smaller, targeted pulse checks after major creative overhauls, packaging changes, or when a major competitor launches a highly aggressive campaign that might threaten your Uniqueness scores.
Why do taglines perform worse than visual assets on the distinctive asset grid?
Visual dominance is a fundamental feature of human cognition. Our brains process visual stimuli significantly faster and store them more durably than verbal or auditory cues.
A tagline requires a consumer to read, process language, and link that language to a brand name. A shape, a character, or a unique color combination bypasses this cognitive friction entirely, triggering instant recognition.
How does the distinctive asset grid apply to B2B and digital-first brands?
The principles of memory encoding are universal; they do not care if you sell soap or enterprise software. For B2B and digital-first brands, the definition of an "asset" simply shifts.
Instead of physical packaging, your assets are your UI/UX patterns, your digital interface elements, your custom illustration styles, and your sonic notifications (think of Slack's knock brush sound or Netflix's "ta-dum"). These digital assets must be mapped, protected, and deployed with the same empirical discipline as a physical CPG box.
Build Your Cognitive Moat
In the age of generative AI, content production has been commoditized. Anyone can produce a beautiful ad, a clean website, or a written guide in seconds.
But you cannot generate a memory structure in a consumer's brain with a prompt.
That requires time, consistency, and relentless discipline. Your brand is not what you say it is; it is the sum of the distinctive cues that category buyers store in their minds. The distinctive asset grid is the only tool that gives you an honest, data-driven look at those memory structures. Stop guessing which parts of your identity are working. Measure them, map them, and build a cognitive moat that no competitor — human or machine — can cross.
To learn how to apply these algorithmic brand strategies to your organization, Sign up for The Brand Algorithm and join our community of senior marketing practitioners.